
1. Before you begin
In this codelab, you learn how to improve the runtime performance of a Compose app. You follow a scientific approach to measure, debug, and optimize performance. You investigate multiple performance issues with system tracing and change non-performant runtime code in a sample app, which contains several screens that represent different tasks. The screens are each built differently and include the following:
- The first screen is a two-column list with image items and some tags on top of the item. Here, you optimize heavy composables.
- The second and third screens contain a frequently recomposing state. Here, you remove unnecessary recompositions to optimize performance.
- The last screen contains unstable items. Here, you stabilize the items with various techniques.
Prerequisites
- Knowledge of how to build Compose apps.
- Basic understanding of testing or running macrobenchmarks.
What you learn
- How to pinpoint performance issues with system traces and composition tracing.
- How to write performant Compose apps that render smoothly.
What you need
- The latest stable version of Android Studio
- A physical Android device with Android 6 (API level 23) or higher
2. Get set up
To get started, follow these steps:
- Clone the GitHub repository:
$ git clone https://github.com/android/codelab-android-compose.git
Alternatively, you can download the repository as a zip file:
- Open the
PerformanceCodelabproject, which contains the following branches:
main: Contains the starter code for this project, where you make changes to complete the codelab.end: Contains the solution code for this codelab.
We recommend that you begin with the main branch and follow the codelab step-by-step at your own pace.
- If you want to see the solution code, run this command:
$ git clone -b end https://github.com/android/codelab-android-compose.git
Alternatively, you can download the solution code:
Optional: System traces used in this codelab
You will run several benchmarks that capture system traces during the codelab.
If you're not able to run these benchmarks, here's a list of system traces you can download instead:
3. Approach to fixing performance issues
Spotting slow, non-performant UI is possible with just plain sight and exploring the app. But before you jump in and start fixing code based on your assumptions, you should measure the performance of your code to understand if your changes will make a difference.
During development, with a debuggable build of your app, you might notice something is not as performant as needed and you might be tempted to start dealing with this problem. But a debuggable app's performance is not representative of what your users will see, so it's important to verify with a non-debuggable app that it actually is a problem. In a debuggable app, all of the code has to be interpreted by the runtime.
When thinking about performance in Compose, there's no hard rule you should follow to implement a particular functionality. You shouldn't do the following prematurely:
- Don't chase and fix every unstable parameter that sneaks into your code.
- Don't remove animations causing recomposition of that composable.
- Don't do hard-to-read optimizations based on your gut feeling.
All of these modifications should be done in an informed way using the available tools to be sure that they're addressing the performance issue.
When dealing with performance issues, you should follow this scientific approach:
- Establish the initial performance by measuring.
- Observe what's causing the problem.
- Modify the code based on the observations.
- Measure and compare with initial performance.
- Repeat.
If you don't follow any structured method, some of the changes might improve performance, but others might degrade it, and you can end up with the same outcome.
We recommend watching the following video on enhancing app performance with Compose that goes through the journey of fixing performance issues and even shows some tips on how to improve it.
Generate Baseline Profiles
Before you dive into investigating performance issues, generate a Baseline Profile for your app. On Android 6 (API level 23) and higher, apps run code interpreted at runtime and compiled just-in-time (JIT) and ahead-of-time (AOT) at installation. Interpreted and JIT compiled code runs slower than AOT, but takes less space on disk and in memory, which is why not all code should be AOT compiled.
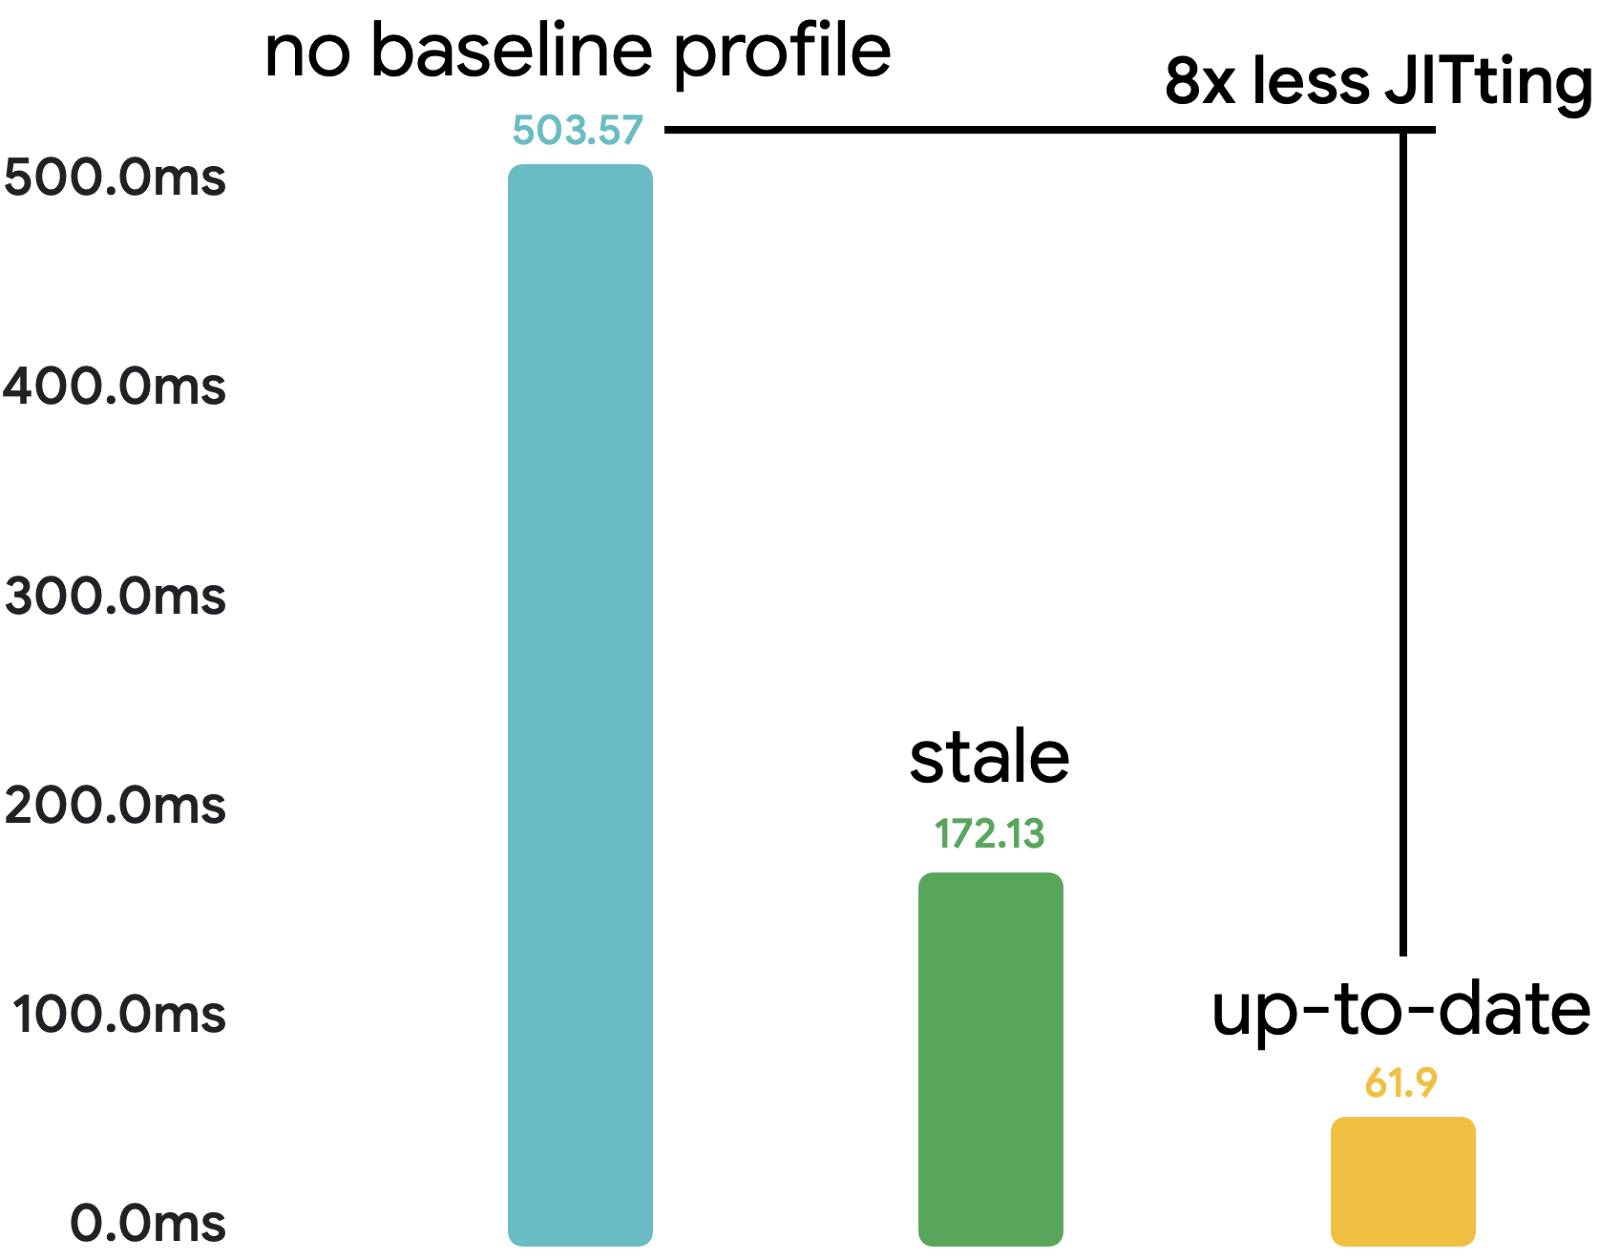
By implementing Baseline Profiles, you can improve your app startup by 30% and reduce the code running in JIT mode at runtime by eight times as shown in the following image based on the Now in Android sample app:
For more information about Baseline Profiles, see the following resources:
Measure performance
To measure performance, we recommend setting up and writing benchmarks with Jetpack Macrobenchmark. Macrobenchmarks are instrumented tests that interact with your app as a user would while monitoring performance of your app. This means they don't pollute the app code with testing code and thus provide reliable performance information.
In this codelab, we already set up the codebase and wrote the benchmarks to focus directly on fixing performance issues. If you're unsure of how to set up and use Macrobenchmark in your project, see the following resources:
- Inspect app performance with Macrobenchmark codelab
- Inspecting Performance–MAD skills
- Write a Macrobenchmark documentation
With Macrobenchmarks, you can choose one of the following compilation modes:
None: Resets the compilation state and runs everything in JIT mode.Partial: Pre-compiles the app with Baseline Profiles and/or warm-up iterations, and runs in JIT mode.Full: Pre-compiles the entire app code, so there's no code running in JIT mode.
In this codelab, you only use the CompilationMode.Full() mode for the benchmarks because you only care about the changes that you make in the code, not the compilation state of the app. This approach lets you reduce the variance that would be caused by the code running in JIT mode, which should be reduced when implementing custom Baseline Profiles. Beware that Full mode can have a negative effect on app startup, so don't use it for benchmarks measuring app startup, but use it only for benchmarks measuring runtime performance improvements.
When you're done with the performance improvements and you want to check the performance to see how it performs when your users install the app, use the CompilationMode.Partial() mode that uses baseline profiles.
In the next section, you learn how to read the traces to find the performance problems.
4. Analyze performance with system tracing
With a debuggable build of your app, you can use the Layout Inspector with composition count to quickly understand when something is recomposing too often.
However, it is only part of the overall performance investigation because you only get proxy measurements and not the actual time those composables took to render. It might not matter much if something recomposes N times if the total duration takes less than a millisecond. But on the other hand, it matters if something is composed just once or twice, and takes 100 milliseconds. Oftentimes, a composable might compose only once, and yet take too long to do that and slow your screen.
To reliably investigate performance issues, and give you insight into what your app is doing and whether it takes longer than it should, you can use system tracing with composition tracing.
System tracing gives you timing information of anything that happens in your app. It doesn't add any overhead to your app and therefore you can keep it in the production app without needing to worry about performance negative effects.
Set up composition tracing
Compose automatically populates some information on its runtime phases like when something is recomposing or when a lazy layout prefetches items. However, it's not enough information to actually figure out what might be a problematic section. You can improve the amount of information by setting up the composition tracing, which gives you the name of every single composable that was composed during the trace. This lets you start investigating performance problems without needing to add many custom trace("label") sections.
To enable Composition tracing, follow these steps:
- Add the
runtime-tracingdependency to your:appmodule:
implementation("androidx.compose.runtime:runtime-tracing:1.0.0-beta01")
At this point, you could record a system trace with Android Studio profiler and it would include all the information, but we will use the Macrobenchmark for performance measurements and system traces recording.
- Add additional dependencies to the
:measuremodule to enable composition tracing with Macrobenchmark:
implementation("androidx.tracing:tracing-perfetto:1.0.0")
implementation("androidx.tracing:tracing-perfetto-binary:1.0.0")
- Add the
androidx.benchmark.fullTracing.enable=trueinstrumentation argument to thebuild.gradlefile of the:measuremodule:
defaultConfig {
    // ...
    testInstrumentationRunnerArguments["androidx.benchmark.fullTracing.enable"] = "true"
}
For more information about how to set up composition tracing, such as how to use it from terminal, see the documentation.
Capture initial performance with Macrobenchmark
There are several ways that you can retrieve a system trace file. For example, you could record with Android Studio profiler, capture it on device, or retrieve a system trace recorded with the Macrobenchmark. In this codelab, you use the traces taken by the Macrobenchmark library.
This project contains benchmarks in the :measure module that you can run to get the performance measurements. The benchmarks in this project are set to only run one iteration to save time during this codelab. In the real app, it's recommended to have at least ten iterations if the output variance is high.
To capture the initial performance, use the AccelerateHeavyScreenBenchmark test that scrolls the screen of the first task screen, follow these steps:
- Open the
AccelerateHeavyScreenBenchmark.ktfile. - Run the benchmark with the gutter action next to the benchmark class:
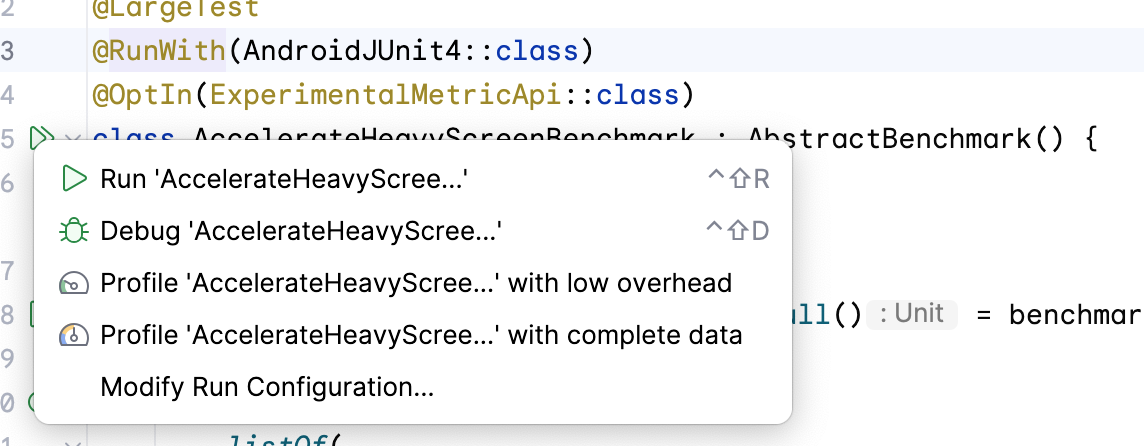
This benchmark scrolls the Task 1 screen and captures frame timing and custom
trace sections.
After the benchmark finishes, you should see the results in the Android Studio output pane:
AccelerateHeavyScreenBenchmark_accelerateHeavyScreenCompilationFull
ImagePlaceholderCount               min  20.0,   median  20.0,   max  20.0
ImagePlaceholderMs                  min  22.9,   median  22.9,   max  22.9
ItemTagCount                        min  80.0,   median  80.0,   max  80.0
ItemTagMs                           min   3.2,   median   3.2,   max   3.2
PublishDate.registerReceiverCount   min   1.0,   median   1.0,   max   1.0
PublishDate.registerReceiverMs      min   1.9,   median   1.9,   max   1.9
frameDurationCpuMs                  P50    5.4,   P90    9.0,   P95   10.5,   P99   57.5
frameOverrunMs                      P50   -4.2,   P90   -3.5,   P95   -3.2,   P99   74.9
Traces: Iteration 0
The important metrics in the output are the following:
frameDurationCpuMs: Tells you how long it took to render frames. The shorter, the better.frameOverrunMs: Tells you how much time was over the frame limit, including the work on GPU. A negative number is good because it means that there was still time.
The other metrics, such as the ImagePlaceholderMs metric, are using custom trace sections and outputs summed duration of all those sections in the trace file and how many times it occurred with the ImagePlaceholderCount metric.
All of these metrics can help us understand if the changes we make to our codebase are improving the performance.
Read the trace file
You can read the system trace from either Android Studio or with the web-based tool Perfetto.
While Android Studio profiler is a good way to quickly open a trace and show the process of your app, Perfetto provides more in-depth investigation capabilities for all processes running on a system with powerful SQL queries and more. In this codelab, you use Perfetto to analyze system traces.
- Open the Perfetto website, which loads the tool's dashboard.
- Locate the system traces captured by Macrobenchmark on your hosting file system, which are saved in
[module]/outputs/connected_android_test_additional_output/benchmarkRelease/connected/[device]/folder. Every benchmark iteration records a separate trace file, each containing the same interactions with your app.
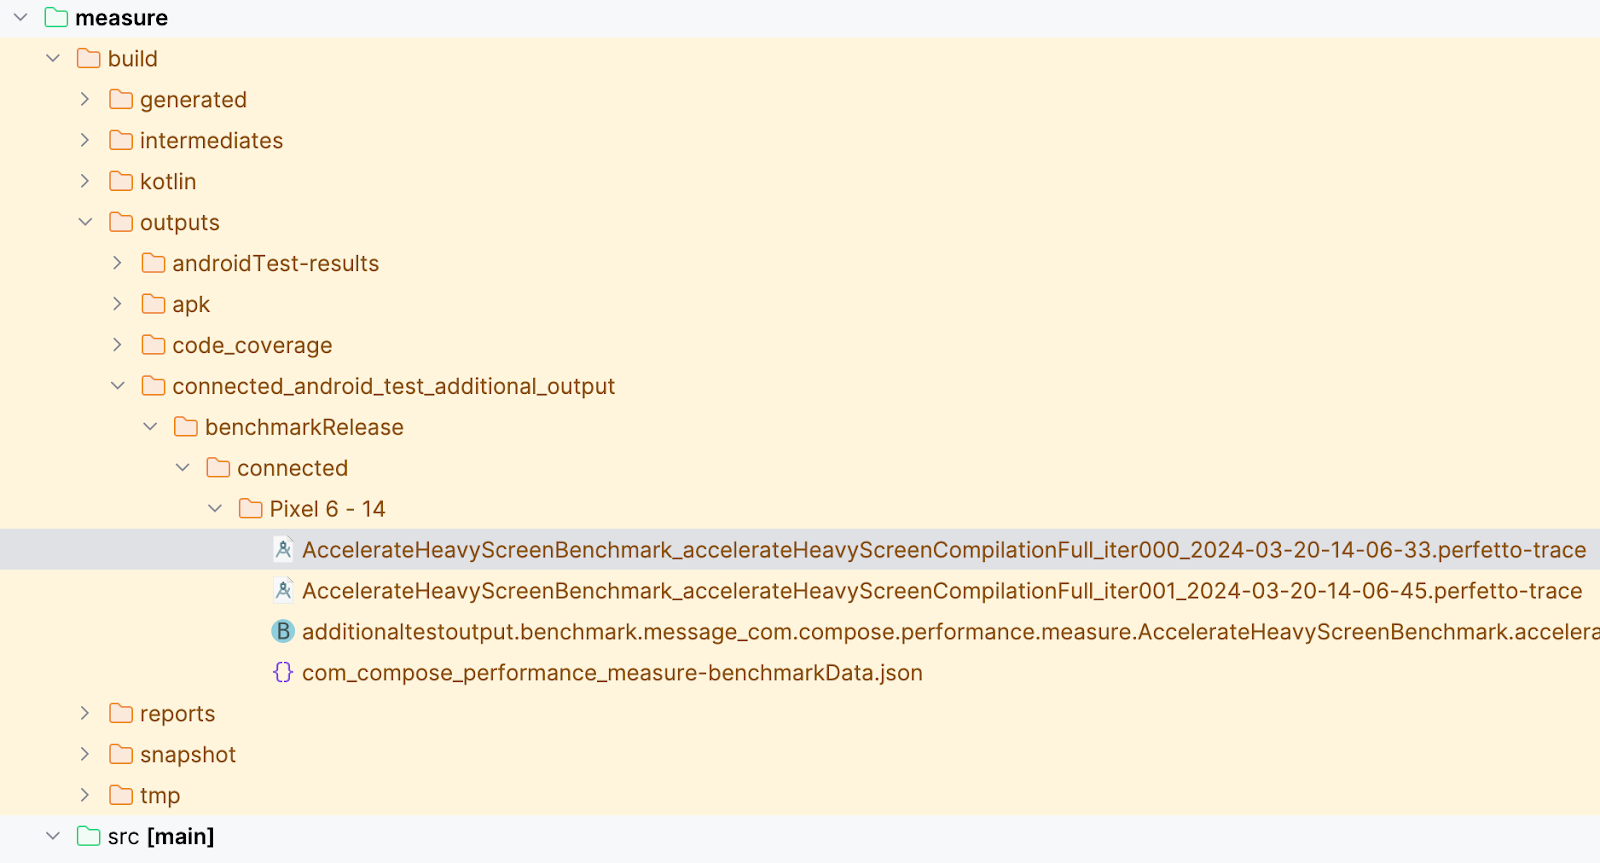
- Drag the
AccelerateHeavyScreenBenchmark_...iter000...perfetto-tracefile to the Perfetto UI and wait until it loads the trace file. - Optional: If you're not able to run the benchmark and generate the trace file, download our trace file and drag it to Perfetto:
- Find the process of your app, which is called com.compose.performance. Usually the foreground app is below the hardware information lanes and a couple of system lanes.
- Open the drop-down menu with the app's process name. You see the list of threads running in your app. Keep the trace file opened because you need it in the next step.
To find a performance problem in your app, you can leverage the Expected and Actual timelines on top of your app's thread list:

The Expected Timeline tells you when the system expects the frames being produced by your app to show fluid, performant UI, which is, in this case, 16ms and 600µs (1000ms / 60). The Actual Timeline shows the real duration of frames produced by your app, including GPU work.
You might see different colors, which indicate the following:
- Green frame: The frame produced on time.
- Red frame: The janky frame took longer than expected. You should investigate the work done in these frames to prevent performance issues.
- Light-green frame: The frame was produced within the time limit, but presented late, resulting in an increased input latency.
- Yellow frame: The frame was janky, but the app wasn't the reason.
When the UI is rendered on screen, the changes are required to be faster than the duration your device expects a frame to be created. Historically this was approximately 16.6ms given that the display refresh rate was 60Hz, but for modern Android devices, it may be approximately 11ms or less because the display refresh rate is 90Hz or faster. It can also be different for each frame due to variable refresh rates.
For example, if your UI is composed of 16 items, then each item has roughly 1ms to be created to prevent any skipped frames. On the other hand, if you only have one item, such as a video player, it can take up to 16ms to compose it without jank.
Understand the system-tracing call chart
In the following image is an example of a simplified version of a system trace showing recomposition.
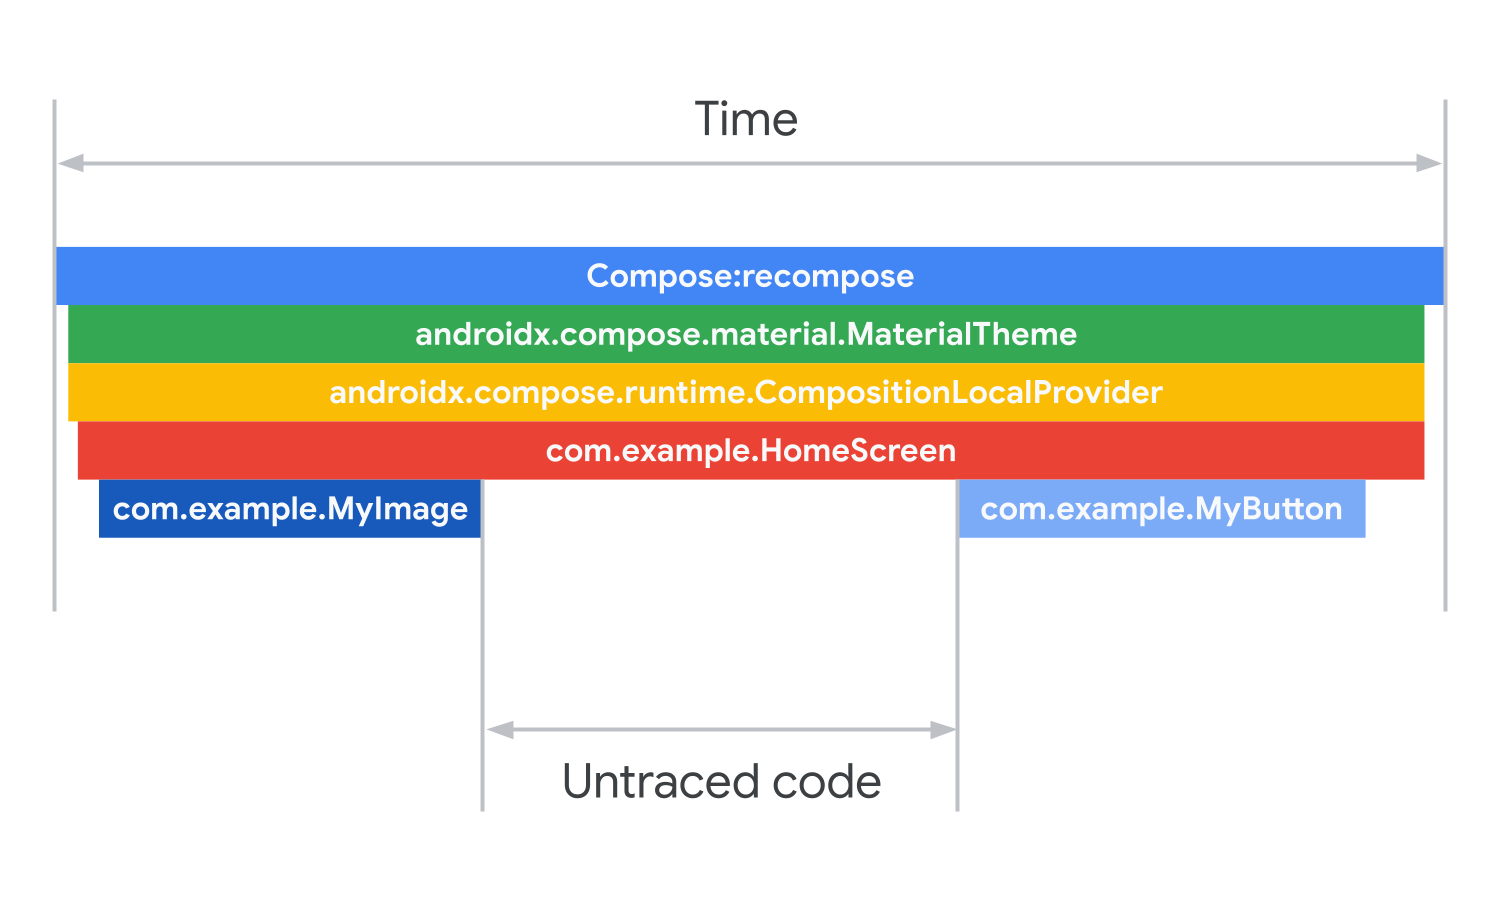
Each bar from the top down is the total time of the bars below it, the bars also correspond to the sections of code of functions called. Compose calls recompose on your composition hierarchy. The first composable is the MaterialTheme. Inside MaterialTheme is a composition local providing the theming information. From there, the HomeScreen composable is called. The home screen composable calls the MyImage and MyButton composables as part of its composition.
Gaps in system traces are from untraced code being run because system traces only show code that is marked for tracing. The code being run is happening after MyImage is called, but before MyButton is called and is taking up the amount of time the gap is sized.
In the next step, you analyze the trace you took in the previous step.
5. Accelerate heavy composables
As a first task when trying to optimize performance of your app, you should seek any heavy composables or a long-running task on the main thread. The long-running work might mean different things depending on how complicated your UI is and how much time there is to compose the UI.
So if a frame is dropped, you need to find which composables are taking too long and make them faster by offloading the main thread or skipping some of the work they do on the main thread.
To analyze the trace taken from the AccelerateHeavyScreenBenchmark test, follow these steps:
- Open the system trace that you took in the previous step.
- Zoom in on the first long frame, which contains the UI initialization after the data is loaded. The content of the frame looks similar to the following image:

In the trace, you can see there are many things happening inside one frame, which can be found under Choreographer#doFrame section. You can see from the image that the biggest chunk of work comes from the composable that contains the ImagePlaceholder section, which loads a big image.
Don't load big images on the main thread
It might be obvious to load images asynchronously from a network using one of the convenience libraries like Coil or Glide, but what if you have a big image locally in your app that you need to show?
The common painterResource composable function that loads an image from resources loads the image on the main thread during composition. This means that if your image is big, it can block the main thread with some work.
In your case, you can see the problem as part of the asynchronous image placeholder. The painterResource composable loads a placeholder image that takes approximately 23ms to load.

There are several ways that you can improve this problem, including the following:
- Load the image asynchronously.
- Make the image smaller so that it loads faster.
- Use a vector drawable that scales based on required size.
To fix this performance problem, follow these steps:
- Navigate to the
AccelerateHeavyScreen.ktfile. - Locate the
imagePlaceholder()composable that loads the image. The placeholder image has dimensions of 1600x1600px, which is clearly too big for what it shows.

- Change the drawable to
R.drawable.placeholder_vector:
@Composable
fun imagePlaceholder() =
    trace("ImagePlaceholder") { painterResource(R.drawable.placeholder_vector) }
- Rerun the
AccelerateHeavyScreenBenchmarktest, which rebuilds the app and takes the system trace again. - Drag the system trace to the Perfetto dashboard.
Alternatively, you can download the trace:
- Search for the
ImagePlaceholdertrace section, which shows you directly the improved part.

- Observe that the
ImagePlaceholderfunction doesn't block the main thread that much anymore.

As an alternative solution in the real app, it might not be a placeholder image causing trouble, but some artwork. In this case, you might use Coil's rememberAsyncImage composable, which loads the composable asynchronously. This solution would show empty space until the placeholder is loaded, so beware that you might need to have a placeholder for these kinds of images.
There are still some other things that don't perform well, which you tackle in the next step.
6. Offload a heavy operation to a background thread
If we keep investigating the same item for additional problems, you will encounter sections with the name binder transaction, which take approximately 1ms each.

Sections called binder transaction show that there was an interprocess communication happening between your process and some system process. It is a normal way of retrieving some information from the system, such as retrieving a system service.
These transactions are included in many of the APIs communicating with the system. For example, when retrieving a system service with getSystemService, registering a broadcast receiver, or requesting a ConnectivityManager.
Unfortunately these transactions don't provide much information about what they're requesting, so you have to analyze your code on the mentioned API usages and then add a custom trace section to be sure it's the problematic part.
To do improve the binder transactions, follow these steps:
- Open the
AccelerateHeavyScreen.ktfile. - Locate the
PublishedTextcomposable. This composable formats a datetime with the current timezone and registers aBroadcastReceiverobject that keeps the track of timezone changes. It contains acurrentTimeZonestate variable with the default system timezone as an initial value and then aDisposableEffectthat registers a broadcast receiver for the timezone changes. Lastly, this composable shows a formatted datetime withText.DisposableEffect, which is a good choice in this scenario because you need a way to unregister the broadcast receiver, which is done in theonDisposelambda. The problematic part, though, is that the code inside theDisposableEffectblocks the main thread:
@Composable
fun PublishedText(published: Instant, modifier: Modifier = Modifier) {
    val context = LocalContext.current
    var currentTimeZone: TimeZone by remember { mutableStateOf(TimeZone.currentSystemDefault()) }

    DisposableEffect(Unit) {
        val receiver = object : BroadcastReceiver() {
            override fun onReceive(context: Context?, intent: Intent?) {
                currentTimeZone = TimeZone.currentSystemDefault()
            }
        }

        // TODO Codelab task: Wrap with a custom trace section
        context.registerReceiver(receiver, IntentFilter(Intent.ACTION_TIMEZONE_CHANGED))

        onDispose { context.unregisterReceiver(receiver) }
    }

    Text(
        text = published.format(currentTimeZone),
        style = MaterialTheme.typography.labelMedium,
        modifier = modifier
    )
}
- Wrap the
context.registerReceiverwith atracecall to ensure that this is indeed what's causing all thebinder transactions:
trace("PublishDate.registerReceiver") {
    context.registerReceiver(receiver, IntentFilter(Intent.ACTION_TIMEZONE_CHANGED))
}
In general, a code running that long on the main thread might not cause many troubles, but the fact that this transaction runs for every single item visible on screen might cause problems. Assuming there are six items visible on screen, they need to be composed with the first frame. These calls alone can take 12ms of time, which is almost the whole deadline for one frame.
To fix this, you need to offload the broadcast registration to a different thread. You can do so with coroutines.
- Get a scope that's tied to the composable lifecycle
val scope = rememberCoroutineScope(). - Inside the effect, launch a coroutine on a dispatcher that isn't
Dispatchers.Main. For example,Dispatchers.IOin this case. This way, the broadcast registration doesn't block the main thread, but the actual statecurrentTimeZoneis kept in the main thread.
val scope = rememberCoroutineScope()

DisposableEffect(Unit) {
    val receiver = object : BroadcastReceiver() {
        override fun onReceive(context: Context?, intent: Intent?) {
            currentTimeZone = TimeZone.currentSystemDefault()
        }
    }

    // launch the coroutine on Dispatchers.IO
    scope.launch(Dispatchers.IO) {
        trace("PublishDate.registerReceiver") {
            context.registerReceiver(receiver, IntentFilter(Intent.ACTION_TIMEZONE_CHANGED))
        }
    }

    onDispose { context.unregisterReceiver(receiver) }
}
There's one more step to optimize this. You don't need a broadcast receiver for each item in the list, but only one. You should hoist it!
You can either hoist it and pass the timezone parameter down the tree of composables or, given it's not used in many places in your UI, you can use a composition local.
For the purpose of this codelab, you keep the broadcast receiver as part of the composables tree. However, in the real app, it might be beneficial to separate it into a data layer to prevent polluting your UI code.
- Define the composition local with the default system timezone:
val LocalTimeZone = compositionLocalOf { TimeZone.currentSystemDefault() }
- Update the
ProvideCurrentTimeZonecomposable that takes acontentlambda to provide the current time zone:
@Composable
fun ProvideCurrentTimeZone(content: @Composable () -> Unit) {
    var currentTimeZone = TODO()

    CompositionLocalProvider(
        value = LocalTimeZone provides currentTimeZone,
        content = content,
    )
}
- Move the
DisposableEffectout of thePublishedTextcomposable into the new one to hoist it there, and replace thecurrentTimeZonewith the state and side effect:
@Composable
fun ProvideCurrentTimeZone(content: @Composable () -> Unit) {
    val context = LocalContext.current
    val scope = rememberCoroutineScope()
    var currentTimeZone: TimeZone by remember { mutableStateOf(TimeZone.currentSystemDefault()) }

    DisposableEffect(Unit) {
        val receiver = object : BroadcastReceiver() {
            override fun onReceive(context: Context?, intent: Intent?) {
                currentTimeZone = TimeZone.currentSystemDefault()
            }
        }

        scope.launch(Dispatchers.IO) {
            trace("PublishDate.registerReceiver") {
                context.registerReceiver(receiver, IntentFilter(Intent.ACTION_TIMEZONE_CHANGED))
            }
        }

        onDispose { context.unregisterReceiver(receiver) }
    }

    CompositionLocalProvider(
        value = LocalTimeZone provides currentTimeZone,
        content = content,
    )
}
- Wrap a composable in which you want the composition local to be valid with the
ProvideCurrentTimeZone. You can wrap the entireAccelerateHeavyScreenas shown in the following snippet:
@Composable
fun AccelerateHeavyScreen(items: List<HeavyItem>, modifier: Modifier = Modifier) {
    // TODO: Codelab task: Wrap this with timezone provider
    ProvideCurrentTimeZone {
        Box(
            modifier = modifier
                .fillMaxSize()
                .padding(24.dp)
        ) {
            ScreenContent(items = items)

            if (items.isEmpty()) {
                CircularProgressIndicator(modifier = Modifier.align(Alignment.Center))
            }
        }
    }
}
- Change the
PublishedTextcomposable to only contain the basic formatting functionality and read the current value of the composition local throughLocalTimeZone.current:
@Composable
fun PublishedText(published: Instant, modifier: Modifier = Modifier) {
    Text(
        text = published.format(LocalTimeZone.current),
        style = MaterialTheme.typography.labelMedium,
        modifier = modifier
    )
}
- Rerun the benchmark, which builds the app.
Alternatively, you can download the system trace with corrected code:
- Drag the trace file to the Perfetto dashboard. All of the
binder transactionssections are gone from the main thread. - Search for the section name that's similar to the previous step. You can find it in one of the other threads created by coroutines (
DefaultDispatch):

7. Remove unnecessary subcompositions
You moved the heavy code from the main thread, so it's not blocking composition anymore. There's still potential for improvement. You can remove some unnecessary overhead in the form of a LazyRow composable in each item.
In the example, each of the items contain a row of tags as highlighted in the following image:

This row is implemented with a LazyRow composable because it's easy to write it this way. Pass the items to the LazyRow composable and it takes care of the rest:
@Composable
fun ItemTags(tags: List<String>, modifier: Modifier = Modifier) {
    // TODO: remove unnecessary lazy layout
    LazyRow(
        modifier = modifier
            .padding(4.dp)
            .fillMaxWidth(),
        horizontalArrangement = Arrangement.spacedBy(2.dp)
    ) {
        items(tags) { ItemTag(it) }
    }
}
The problem is that while Lazy layouts excel in layouts where you have much more items than the constrained size, they incur some additional cost, which is unnecessary when the lazy composition is not required.
Given the nature of Lazy composables, which use a SubcomposeLayout composable, they are always shown as multiple chunks of work, first the container and then the items that are currently visible on screen, which is the second chunk of work. You can also find a compose:lazylist:prefetch trace in the system trace, which indicates that additional items are getting into the viewport and therefore they're prefetched to be ready in advance.

To determine roughly how much time this takes in your case, open the same trace file. You can see that there are sections detached from the parent item. Each item consists of the actual item being composed and then the tags items. This way each item results in roughly 2.5 milliseconds of composition time, which, if you multiply by the number of visible items, gives another big chunk of work.

To fix this, follow these steps:
- Navigate to the
AccelerateHeavyScreen.ktfile and locate theItemTagscomposable. - Change the
LazyRowimplementation to aRowcomposable that iterates over thetagslist as in the following snippet:
@Composable
fun ItemTags(tags: List<String>, modifier: Modifier = Modifier) {
    Row(
        modifier = modifier
            .padding(4.dp)
            .fillMaxWidth()
        horizontalArrangement = Arrangement.spacedBy(2.dp)
    ) {
        tags.forEach { ItemTag(it) }
    }
}
- Rerun the benchmark, which will also build the app.
- Optional: Download the system tracing with corrected code:
- Find the
ItemTagsections, observe that it takes less time, and it uses the sameCompose:recomposeroot section.

A similar situation might occur with other containers using a SubcomposeLayout composable, for example a BoxWithConstraints composable. It can span creation of the items across Compose:recompose sections, which might not be shown directly as a janky frame, but can be visible to the user. If you can, try to avoid a BoxWithConstraints composable in each item as it might only be needed when you compose a different UI based on the available space.
In this section you learned how to fix compositions that take too long.
8. Compare results with the initial benchmark
Now that you have finished optimizing the screen for performance, you should compare the benchmark results to the initial results.
- Open the Test History in Android Studio run pane
- Select the oldest run that relates to the initial benchmark without any changes and compare the
frameDurationCpuMsandframeOverrunMsmetrics. You should see results similar to the following table:

Before
AccelerateHeavyScreenBenchmark_accelerateHeavyScreenCompilationFull
ImagePlaceholderCount               min  20.0,   median  20.0,   max  20.0
ImagePlaceholderMs                  min  22.9,   median  22.9,   max  22.9
ItemTagCount                        min  80.0,   median  80.0,   max  80.0
ItemTagMs                           min   3.2,   median   3.2,   max   3.2
PublishDate.registerReceiverCount   min   1.0,   median   1.0,   max   1.0
PublishDate.registerReceiverMs      min   1.9,   median   1.9,   max   1.9
frameDurationCpuMs                  P50    5.4,   P90    9.0,   P95   10.5,   P99   57.5
frameOverrunMs                      P50   -4.2,   P90   -3.5,   P95   -3.2,   P99   74.9
Traces: Iteration 0
- Select the newest run that relates to the benchmark with all the optimizations. You should see results similar to the following table:
After
AccelerateHeavyScreenBenchmark_accelerateHeavyScreenCompilationFull
ImagePlaceholderCount               min  20.0,   median  20.0,   max  20.0
ImagePlaceholderMs                  min   2.9,   median   2.9,   max   2.9
ItemTagCount                        min  80.0,   median  80.0,   max  80.0
ItemTagMs                           min   3.4,   median   3.4,   max   3.4
PublishDate.registerReceiverCount   min   1.0,   median   1.0,   max   1.0
PublishDate.registerReceiverMs      min   1.1,   median   1.1,   max   1.1
frameDurationCpuMs                  P50    4.3,   P90    7.7,   P95    8.8,   P99   33.1
frameOverrunMs                      P50  -11.4,   P90   -8.3,   P95   -7.3,   P99   41.8
Traces: Iteration 0
If you specifically check the frameOverrunMs row, you can see that all of the percentiles improved:
P50 | P90 | P95 | P99 | |
before | -4.2 | -3.5 | -3.2 | 74.9 |
after | -11.4 | -8.3 | -7.3 | 41.8 |
improvement | 171% | 137% | 128% | 44% |
In the next section, you learn how to fix a composition that happens too often.
9. Prevent unnecessary recompositions
Compose has 3 phases:
- Composition determines what to show by building a tree of composables.
- Layout takes that tree and determines where the composables will appear on screen.
- Drawing draws the composables on the screen.
The order of these phases is generally the same, allowing data to flow in one direction from composition to layout to drawing to produce a UI frame.

BoxWithConstraints, lazy layouts (for example LazyColumn or LazyVerticalGrid) and all layouts based on SubcomposeLayout composables are notable exceptions, where the composition of children depends on the parents' layout phases.
Generally, composition is the most expensive phase to run as there is the most work to do and you may also cause other unrelated composables to recompose.
Most frames contain all three phases, but Compose can actually skip a phase entirely if there's no work to do. You can take advantage of this capability to increase the performance of your app.
Defer composition phases with lambda modifiers
Composable functions are run in the composition phase. To allow code to be run at a different time, you can provide it as a lambda function.
To do so, follow these steps:
- Open the
PhasesComposeLogo.ktfile - Navigate to the Task 2 screen within the app. You see a logo that bounces off the edge of the screen.
- Open the Layout Inspector and inspect Recomposition counts. You see a rapidly increasing number of recompositions.

- Optional: Locate the
PhasesComposeLogoBenchmark.ktfile and run it to retrieve the system trace to see the composition ofPhasesComposeLogotrace section that occurs on every frame. Recompositions are shown in a trace as repeating sections with the same name.


- If necessary, close the profiler and Layout Inspector, and then return to the code. You see the
PhaseComposeLogocomposable that looks like the following:
@Composable
fun PhasesComposeLogo() = trace("PhasesComposeLogo") {
    val logo = painterResource(id = R.drawable.compose_logo)
    var size by remember { mutableStateOf(IntSize.Zero) }
    val logoPosition by logoPosition(size = size, logoSize = logo.intrinsicSize)

    Box(
        modifier = Modifier
            .fillMaxSize()
            .onPlaced {
                size = it.size
            }
    ) {
        with(LocalDensity.current) {
            Image(
                painter = logo,
                contentDescription = "logo",
                modifier = Modifier.offset(logoPosition.x.toDp(), logoPosition.y.toDp())
            )
        }
    }
}
The logoPosition composable contains logic that changes its state with every frame and looks as follows:
@Composable
fun logoPosition(size: IntSize, logoSize: Size): State<IntOffset> =
    produceState(initialValue = IntOffset.Zero, size, logoSize) {
        if (size == IntSize.Zero) {
            this.value = IntOffset.Zero
            return@produceState
        }

        var xDirection = 1
        var yDirection = 1

        while (true) {
            withFrameMillis {
                value += IntOffset(x = MOVE_SPEED * xDirection, y = MOVE_SPEED * yDirection)

                if (value.x <= 0 || value.x >= size.width - logoSize.width) {
                    xDirection *= -1
                }

                if (value.y <= 0 || value.y >= size.height - logoSize.height) {
                    yDirection *= -1
                }
            }
        }
    }
The state is being read in the PhasesComposeLogo composable with the Modifier.offset(x.dp, y.dp) modifier, which means that it reads it in composition.
This modifier is why the app recomposes on every frame of this animation. In this case, there is a simple alternative: the lambda-based Offset modifier.
- Update the
Imagecomposable to use theModifier.offsetmodifier, which accepts a lambda that returnsIntOffsetobject as in the following snippet:
Image(
  painter = logo,
  contentDescription = "logo",
  modifier = Modifier.offset { IntOffset(logoPosition.x,  logoPosition.y) }
)
- Rerun the app and check the layout inspector. You see that the animation no longer generates any recomposition.
Remember, you shouldn't have to recompose only to adjust the layout of a screen, especially during scroll, which leads to janky frames. Recomposition that occurs during scroll is almost always unnecessary and should be avoided.
Other lambda modifiers
The Modifier.offset modifier isn't the only modifier with the lambda version. In the following table, you can see the common modifiers that would recompose every time, which can be replaced with its deferred alternatives when passing in a state value that frequently changes:
Common modifier | Deferred alternative |
|
|
|
|
|
|
10. Defer Compose phases with custom layout
Using a lambda-based modifier is often the easiest way to avoid invalidating the composition, but sometimes there isn't a lambda-based modifier that does what you need. In these cases, you can directly implement a custom layout or even Canvas composable to go straight to the draw phase. Compose state reads done inside a custom layout only invalidate layout and skip recomposition. As a general guideline, if you only want to adjust the layout or size, but not add or remove composables, you can often achieve the effect without invalidating composition at all.
To do so, follow these steps:
- Open the
PhasesAnimatedShape.ktfile and then run the app. - Navigate to the Task 3 screen. This screen contains a shape that changes size when you click a button. The size value is animated with the
animateDpAsStateCompose animation API.
- Open the Layout Inspector.
- Click Toggle size.
- Observe that the shape recomposes on every frame of the animation.

The MyShape composable takes the size object as a parameter, which is a state read. This means that when the size object changes, the PhasesAnimatedShape composable (the nearest recomposition scope) is recomposed and subsequently the MyShape composable is recomposed because its inputs have changed.
To skip recomposition, follow these steps:
- Change the
sizeparameter to a lambda function so that the size changes don't directly recompose theMyShapecomposable:
@Composable
fun MyShape(
    size: () -> Dp,
    modifier: Modifier = Modifier
) {
  // ...
- Update the call site in the
PhasesAnimatedShapecomposable to use the lambda function:
MyShape(size = { size }, modifier = Modifier.align(Alignment.Center))
Changing the size parameter to a lambda delays the state read. Now it occurs when the lambda is invoked.
- Change the body of the
MyShapecomposable to the following:
Box(
    modifier = modifier
        .background(color = Purple80, shape = CircleShape)
        .layout { measurable, _ ->
            val sizePx = size()
                .roundToPx()
                .coerceAtLeast(0)

            val constraints = Constraints.fixed(
                width = sizePx,
                height = sizePx,
            )

            val placeable = measurable.measure(constraints)
            layout(sizePx, sizePx) {
                placeable.place(0, 0)
            }
        }
)
On the first line of the layout modifier measure lambda, you can see that the size lambda is invoked. This is inside the layout modifier, so it only invalidates layout, not composition.
- Rerun the app, navigate to the Task 3 screen, and then open the Layout Inspector.
- Click Toggle Size and then observe that the size of the shape animates the same as before, but the
MyShapecomposable doesn't recompose.
11. Prevent recompositions with stable classes
Compose generates code that can skip execution of the composable if all of its input parameters are stable and haven't changed from previous composition. A type is stable if it is immutable or if it is possible for the Compose engine to know whether its value has changed between recompositions.
If the Compose engine isn't sure if a composable is stable, it will treat it as unstable and won't generate the code logic for skipping recomposition, which means that the composable will recompose every time. This can occur when a class is not a primitive type and one of the following situations occur:
- It's a mutable class. For example, it contains a mutable property.
- It's a class defined in a Gradle module that doesn't use Compose. They don't have a dependency on Compose compiler.
- It's a class that contains an unstable property.
This behavior can be undesirable in some cases, where it causes performance issues and can be changed when you do the following:
- Enable the strong skipping mode
- Annotate the parameter with a
@Immutableor@Stableannotation. - Add the class to the stability configuration file.
For more information on stability, read the documentation.
In this task, you have a list of items that can be added, removed, or checked, and you need to make sure that the items don't recompose when recomposition is unnecessary. There are two types of items alternating between ones that are recreated every time and ones that don't.
The items that are recreated every time are here as a simulation of the real-world use case where data comes from a local database (for example Room or sqlDelight) or remote data source (such as API requests or Firestore entities), and returns a new instance of the object every time that there's a change.
Several composables have a Modifier.recomposeHighlighter() modifier attached, which you can find in our GitHub repository. This modifier shows a border whenever a composable is recomposed and can serve as an alternative temporary solution to Layout inspector.
Enable strong skipping mode
Jetpack Compose compiler 1.5.4 and higher comes with an option to enable strong skipping mode, which means that even composables with unstable parameters can generate skipping code. This mode is expected to radically reduce the amount of unskippable composables in your project, thus improving performance without any code change.
For the unstable parameters, the skipping logic is compared for instance equality, which means that parameter would be skipped if the same instance was passed to the composable as in the previous case. In contrast, stable parameters use structural equality (by calling the Object.equals()method) to determine skipping logic.
In addition to skipping logic, strong skipping mode also automatically remembers lambdas that are inside a composable function. This fact means that you don't need a remember call to wrap a lambda function, for example one that calls a ViewModel method.
The strong skipping mode can be enabled on a Gradle module basis.
To enable it, follow these steps:
- Open the app
build.gradle.ktsfile. - Update the
composeCompilerblock with the following snippet:
composeCompiler {
    // Not required in Kotlin 2.0 final release
    suppressKotlinVersionCompatibilityCheck = "2.0.0-RC1"

    // This settings enables strong-skipping mode for all module in this project.
    // As an effect, Compose can skip a composable even if it's unstable by comparing it's instance equality (===).
    enableExperimentalStrongSkippingMode = true
}
This adds the experimentalStrongSkipping compiler argument to the Gradle module.
- Click
Sync project with Gradle files.
- Rebuild the project.
- Open the Task 5 screen, and then observe that the items that use structural equality are marked with an
EQUicon and don't recompose when you interact with the list of items.
 Sync project with Gradle files.
However, other types of items are still recomposed. You fix them in the next step.
Fix stability with annotations
As mentioned previously, with strong skipping mode enabled, a composable will skip its execution when the parameter has the same instance as in previous composition. This, however, is not true in situations where with every change a new instance of the unstable class is provided.
In your situation, the StabilityItem class is unstable because it contains an unstable LocalDateTime property.
To fix the stability of this class, follow these steps:
- Navigate to the
StabilityViewModel.ktfile. - Locate the
StabilityItemclass and annotate it with@Immutableannotation:
// TODO Codelab task: make this class Stable
@Immutable
data class StabilityItem(
    val id: Int,
    val type: StabilityItemType,
    val name: String,
    val checked: Boolean,
    val created: LocalDateTime
)
- Rebuild the app.
- Navigate to the Task 5 screen and observe that none of the list items are recomposed.
This class now uses the structural equality for checking if it changed from previous composition and thus not recomposing them.
There's still the composable that refers to the date of the latest change, which keeps recomposing regardless of what you did until now.
Fix stability with the configuration file
The previous approach works well for classes that are part of your codebase. However, classes that are out of your reach, such as classes from third-party libraries or standard library classes, can't be edited.
You can enable a stability configuration file that takes classes (with possible wildcards) that will be treated as stable.
To enable this, follow these steps:
- Navigate to the app
build.gradle.ktsfile. - Add the
stabilityConfigurationFileoption to thecomposeCompilerblock:
composeCompiler {
    ...

    stabilityConfigurationFile = project.rootDir.resolve("stability_config.conf")
}
- Sync the project with Gradle files.
- Open the
stability_config.conffile in the root folder of this project next to theREADME.mdfile. - Add the following:
// TODO Codelab task: Make a java.time.LocalDate class stable.
java.time.LocalDate
- Rebuild the app. If the date stays the same, the
LocalDateTimeclass won't cause the Latest change was YYYY-MM-DD composable to recompose.
In your app, you can extend the file to contain patterns, so you don't have to write all the classes that should be treated as stable. So in your case, you can use java.time.* wildcard, which will treat all classes in the package as stable, such as Instant, LocalDateTime, ZoneId, and other classes from java time.
By following the steps, nothing on this screen recomposes except for the item that was added or interacted with, which is expected behavior.
12. Congratulations
Congratulations, you optimized the performance of a Compose app! While only showing a small portion of the performance issues that you might encounter in your app, you learned how to look at other potential problems and how to fix them.
What's next?
If you haven't generated a Baseline Profile for your app, we highly recommend doing so.
You can follow the codelab Improve app performance with Baseline Profiles. If you want more information on setting up benchmarks, see this codelab Inspect app performance with Macrobenchmark.